Solar Panel Installer Southport · an independent guide · Your roof
How much solar panels make on a Southport roof
Southport sits on the open coastal plain at the north-west edge of Merseyside, and its roofs get more sun than towns further inland. Here is what the European Commission's PVGIS model gives for every roof direction and pitch, and how little it changes across the town.
Figures checked at source on 3 November 2026. Written by SEO Dons, who neither sell nor fit solar panels.
Every direction and pitch
The grid below gives PVGIS's yearly output for one kW of panels in central Southport, for eight directions and five roof pitches. It uses the model's satellite-based sunshine record for 2005 to 2023, typical system losses of 14%, and the shading of the surrounding land, but not of your own trees, chimneys or neighbours.
| Roof faces | 10° | 20° | 30° | 40° | 50° |
|---|---|---|---|---|---|
| South | 903 | 960 | 995 | 1,009 | 999 |
| South-west | 882 | 922 | 945 | 950 | 934 |
| South-east | 876 | 911 | 930 | 931 | 913 |
| West | 825 | 818 | 804 | 781 | 748 |
| East | 817 | 802 | 783 | 757 | 721 |
| North-west | 764 | 700 | 639 | 582 | 527 |
| North-east | 758 | 688 | 623 | 563 | 508 |
| North | 735 | 647 | 560 | 475 | 397 |
PVGIS 5.3 (European Commission Joint Research Centre), SARAH3 data 2005 to 2023, crystalline silicon, 14% losses, terrain horizon. Pulled for 53.647° N, 3.006° W on 3 November 2026.
Three patterns are worth knowing. South-facing roofs do best between 30 and 50 degrees, which covers most pitched roofs in Southport. East and west roofs do slightly better at a shallow pitch than a steep one, because a flatter panel sees more of the sky through the middle of the day. North-facing roofs lose ground fast as they get steeper.
Across the town
We pulled the same south-facing, 35-degree figure for points across Southport. The differences are small: the open, low-lying ground gives every district a similar view of the sky.
| Point | kWh per kW |
|---|---|
| Town centre | 1,005 |
| Birkdale | 1,005 |
| Ainsdale | 1,004 |
| Churchtown | 999 |
| Hesketh Park | 998 |
| High Park | 998 |
| Woodvale | 998 |
| Blowick | 989 |
| Crossens | 986 |
PVGIS 5.3, as above. Points are approximate district centres.
Month by month
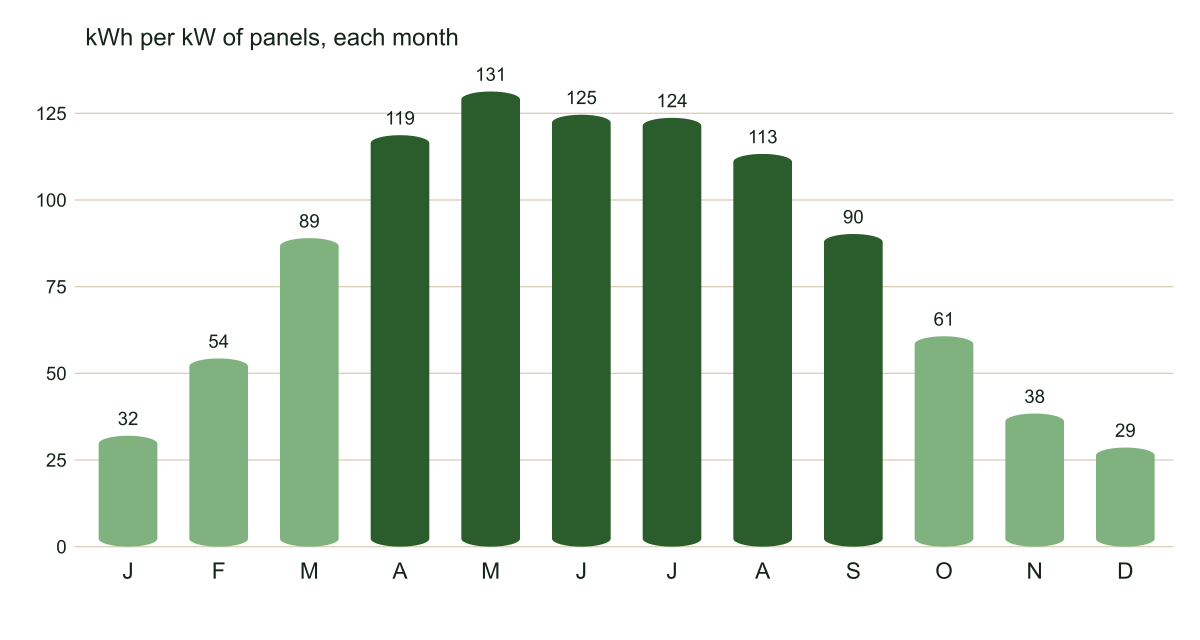
Output follows the season closely. A south roof at 35 degrees makes about 70% of its year between April and September.
| Month | kWh per kW |
|---|---|
| January | 32 |
| February | 54 |
| March | 89 |
| April | 119 |
| May | 131 |
| June | 125 |
| July | 124 |
| August | 113 |
| September | 90 |
| October | 61 |
| November | 38 |
| December | 29 |
Sunshine hours and what the panels make
The Met Office has no 1991–2020 sunshine record for Southport itself; the nearest station, Blackpool Squires Gate, averages about 1,592 hours of bright sunshine a year, from about 49 hours in December to about 218 in May. May has roughly 4.4 times December's sunshine, and a south roof here makes roughly 4.6 times as much in May as in December. Panels keep working under cloud, so hours of bright sunshine are only a rough guide, but the season sets the pattern either way.
Low winter sun also changes which surface does best. From November to February an upright panel on a south-facing wall makes a little more per kW each month than one on a 35° roof, even though over the whole year it manages only about 73% as much.
One year against another
The yearly figures are averages. PVGIS puts the year-to-year standard deviation for a south roof here at about 33 kWh per kW, around 3.3% of the average, so a dull summer can leave a system's first year a few per cent short of its prediction without anything being wrong. Judge it over two or three years before you worry.
Using these figures
An installer's quote must predict yearly output using the MCS method, which is based on its own irradiance tables and a shade assessment. Its answer will not match PVGIS exactly. If the two are within about 10%, they agree; if the quote is well above PVGIS for your direction and pitch, ask how it was worked out. The roof planner applies the grid above to the number of panels your roof can take.
Read on
Sources for this page
Questions about output
How much electricity do solar panels produce in Southport?
PVGIS, the European Commission's solar model, gives central Southport about 1,005 kWh a year for each kW of panels facing south at 35 degrees, after typical system losses. A 4 kW system there would make about 4,019 kWh a year.
Is Southport sunny enough for solar panels?
Yes. Its figure is higher than PVGIS gives inland: about 937 kWh per kW for the same roof in central Warrington, for example. PVGIS's best tilt for a south roof here is 41 degrees, giving about 1,009 kWh per kW a year. Shading on your own roof matters far more than the difference between towns.
Does it matter which part of Southport I live in?
Hardly. Across the points we checked, from Crossens to Town centre, the figure for a south roof varies by about 1.9%. Your roof's direction, pitch and shade make a far bigger difference.
Want a second opinion on your roof or a quote?
Tell us about the house, the roof or the quote, with your Southport postcode. The message goes to SEO-DONS LTD, the company that publishes this independent guide, and we answer by email. It costs nothing and commits you to nothing.
What happens next
- Fill in the form. A full postcode tells us which part of Southport, and which rules, apply.
- We read what you sent and reply by email with the figures and sources that fit your house.
- What you do next, and which firm you use, is your decision alone.