Solar Panel Installer Southport · an independent guide · Getting it done
Southport roofs in numbers
The figures behind the guide: what kind of houses Southport has, how old they are, how efficient, who owns them, and how many already have panels. Every number comes from an official source, read on 3 November 2026.
Figures checked at source on 3 November 2026. Written by SEO Dons, who neither sell nor fit solar panels.
The houses
The Census does not publish tables for the Southport built-up area, so these figures are for the Southport parliamentary constituency on its 2010 boundary: the seven Sefton wards of Ainsdale, Birkdale, Cambridge, Dukes, Kew, Meols and Norwood.
| Type | Southport | Sefton |
|---|---|---|
| Semi-detached | 47.5% | 46.1% |
| Detached | 19.3% | 16.2% |
| Terraced | 6.5% | 18.4% |
| Purpose-built flat | 16.6% | 13.6% |
| Flat in a converted or shared house | 7.7% | 4.2% |
| Other converted building or commercial building | 2.3% | 1.6% |
ONS Census 2021, from household counts (our percentages). Read 3 November 2026.
Who owns them
40.2% of Southport households own their home outright and 27.5% with a mortgage, so roughly two in three can decide on solar for themselves. 23.6% rent privately, more than Sefton's 18.2%, and need a landlord's agreement. Only 7.6% rent from a council or housing association. With 25.6% of residents aged 65 or over, Southport is an older town than Sefton as a whole (23.2%), which matters for solar because people at home in the day use more of their panels' output.
How old they are
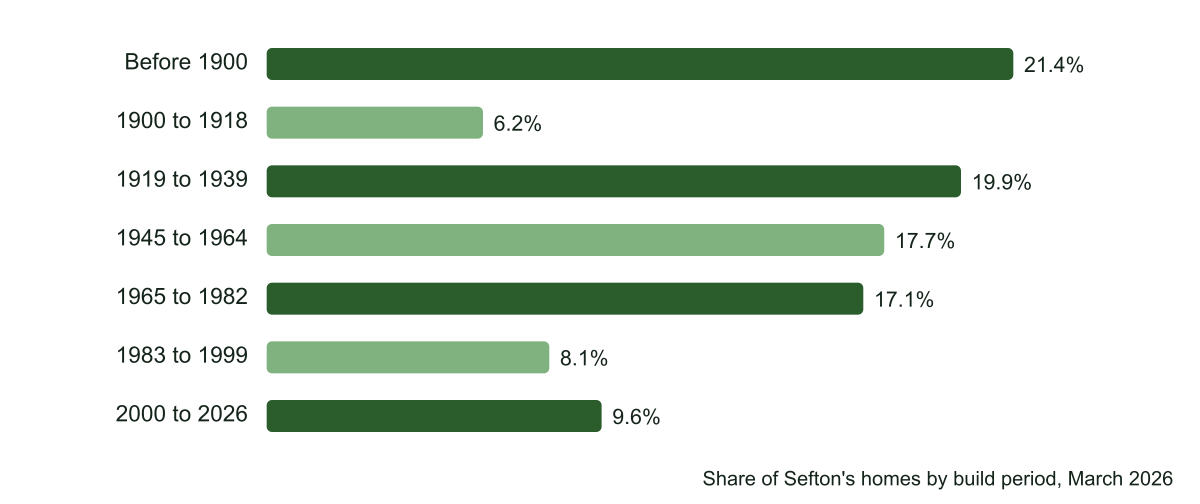
Council tax records count 132,270 dwellings in Sefton. 27.5% were built before 1919, against 20.4% across England and Wales, and 47.4% before 1945; only 9.6% are from 2000 or later. Bungalows are 6.8% of the stock (England and Wales 9.1%) and flats and maisonettes 20.8%. The figures are for Sefton as a whole; council tax build periods are not published for Southport alone.
How efficient they are
48.94% of Sefton's homes have an EPC of C or better, below England's 53.28%, and the median score is 68 against England's 69. Among homes built before 1929, only 29.72% reach C, with a median of 63. In the Southport constituency on its current boundary, 48.09% reach C. Homes rated D or below are the ones the Warm Homes: Local Grant is for; see grants.
Solar so far
| Borough | Per 10,000 households |
|---|---|
| Knowsley | 798 |
| St Helens | 447 |
| Liverpool | 389 |
| Wirral | 376 |
| Sefton | 322 |
Our calculation from DESNZ's renewable electricity by local authority (installations and household estimates, end of 2025).
Sefton had 3,964 solar installations of all sizes at the end of 2025, with 19.02 MW of capacity, up from 3,272 a year earlier: growth of 21%. Even so, it has the fewest per household of the five Merseyside boroughs. DESNZ's constituency figures put home installations in the Southport seat (current boundary) at 1,599, totalling 7.248 MW, at September 2026: about 3.4 for every 100 dwellings. Nationally, new home systems installed in September 2026 averaged about 5.7 kW each, more than our hipped semi example can take.
Sun and prices
PVGIS gives a south roof at 35 degrees in central Southport about 1,005 kWh a year per kW. The Met Office has no 1991–2020 climate station in Southport; the nearest, Blackpool Squires Gate, records about 1,592 hours of sunshine a year. House prices in Sefton averaged £221,105 in August 2026, up 2% on a year; semis £246,240, detached houses £386,996.
Read on
Sources for this page
- ONS Census 2021: Southport constituency (2010 boundary) and Sefton, accommodation, tenure and age
- Census 2021 TS044: accommodation type (Nomis)
- Census 2021 TS054: tenure (Nomis)
- HMRC (formerly VOA): Council Tax stock of properties 2026
- ONS: energy efficiency of housing in England and Wales
- DESNZ: renewable electricity by local authority, 2014 to 2025
- DESNZ: solar photovoltaics deployment, sub-regional statistics
- HM Land Registry: UK House Price Index, Sefton, August 2026
- European Commission JRC: PVGIS 5.3 solar output model
- Met Office: Blackpool, Squires Gate climate averages 1991–2020
Questions about the figures
How many homes in Southport have solar panels?
DESNZ counted 1,599 home solar installations in the Southport constituency at September 2026 (7.248 MW), roughly 3.4 for every 100 dwellings. Across Sefton there were 3,964 solar installations of all kinds at the end of 2025.
How does Sefton compare with the rest of Merseyside for solar?
It has the fewest installations per household of the five Merseyside boroughs: about 322 per 10,000 households at the end of 2025, against 798 in Knowsley, 447 in St Helens, 389 in Liverpool and 376 on Wirral (our calculation from DESNZ figures).
What is the average house price in Sefton?
£221,105 in August 2026, up 2% on a year (HM Land Registry). Semi-detached houses averaged £246,240.
Want a second opinion on your roof or a quote?
Tell us about the house, the roof or the quote, with your Southport postcode. The message goes to SEO-DONS LTD, the company that publishes this independent guide, and we answer by email. It costs nothing and commits you to nothing.
What happens next
- Fill in the form. A full postcode tells us which part of Southport, and which rules, apply.
- We read what you sent and reply by email with the figures and sources that fit your house.
- What you do next, and which firm you use, is your decision alone.